Learn how to calculate profit-based client lifetime value and Customer Acquisition Cost. You will also understand why the ratio of these two numbers is so vital for your B2B company.
Contents
How to Calculate Your LTV:CAC ratio ⫸
Infographic: How revenue, lifetime profit and cost to acquire a customer is connected ⫸
Example for your LTV:CAC ratio ⫸
3 things that LTV:CAC ratio cannot do for you ⫸
When is a single LTV:CAC ratio not enough? ⫸
Bonus Tip: Group Clients in LTV:CAC Cohorts ⫸
Visualize LTV:CAC and other essential B2B metrics with Growlytics ⫸
How to calculate your LTV:CAC ratio
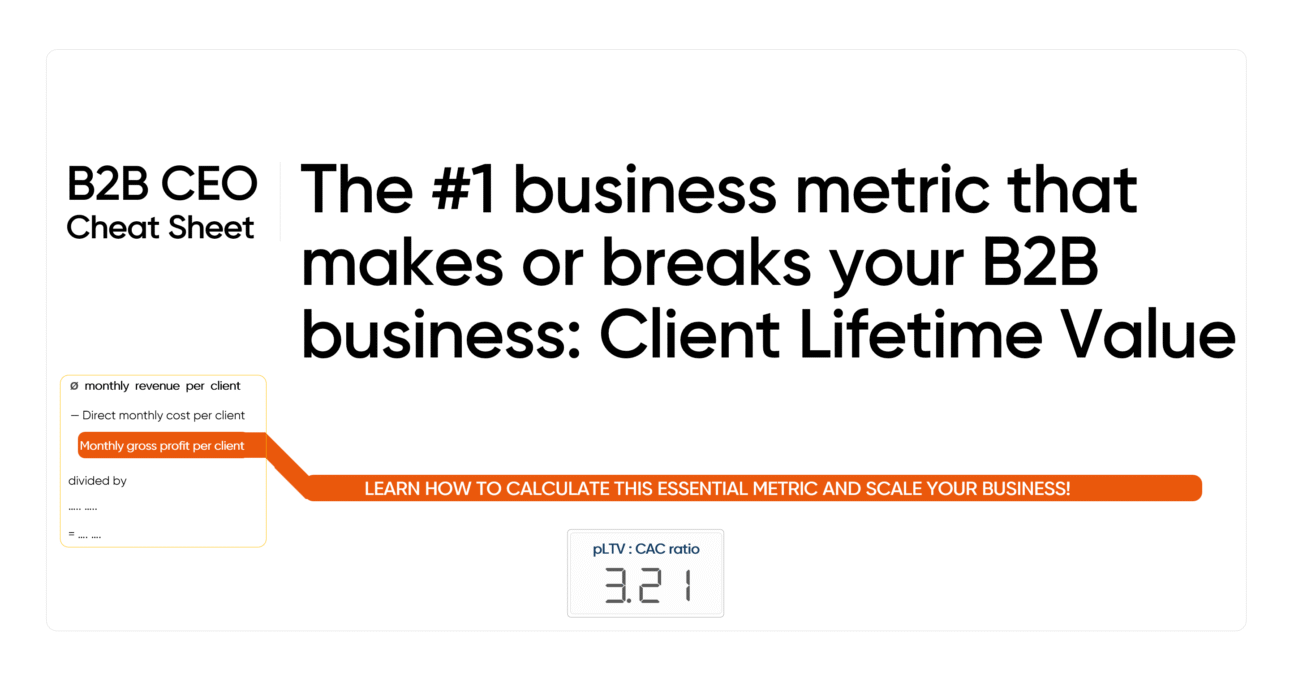
Do you know how much lifetime profit you are generating for every € you’ve spent to acquire a customer?
To calculate it, you need 3 ingredients:
1) Take your monthly invoice amount that you are typically billing to a client. This is your average monthly revenue per client.
↓
2) From the amount above, deduct your direct cost you incur to render the services delivered for one client for one month.
↓
3) Multiply the result with the number of months a typical client stays with your company.
The result is your profit-based customer lifetime value (pLTV), one of the most vital business metrics for any B2B business, its owners, and the C-level execs.
In a last step, divide pLTV by the cost to acquire a new client (CAC), and you will likely get a ratio of about 3 to 5.
(Ø monthly revenue per client - direct monthly cost per client) • Ø client lifespan in months
Customer Aquisition Cost (CAC)
=pLTV:CAC Ratio
A ratio of, for example 3.31 would mean that you generate 3.31 € profit for every 1 € you are spending to acquire a customer.
- A ratio of four would be better and gives you plenty of room to built a financially resilient company.
- A ratio of five is very good and six and above is, in most cases, an exceptional result! This means that you have room to experiment with all available marketing channels, you can innovate (and you should!) plus you have room to hire the best of the best for expert and management roles!
pLTV:CAC tells you how much lifetime profit you generate for every dollar you spend to acquire a customer.
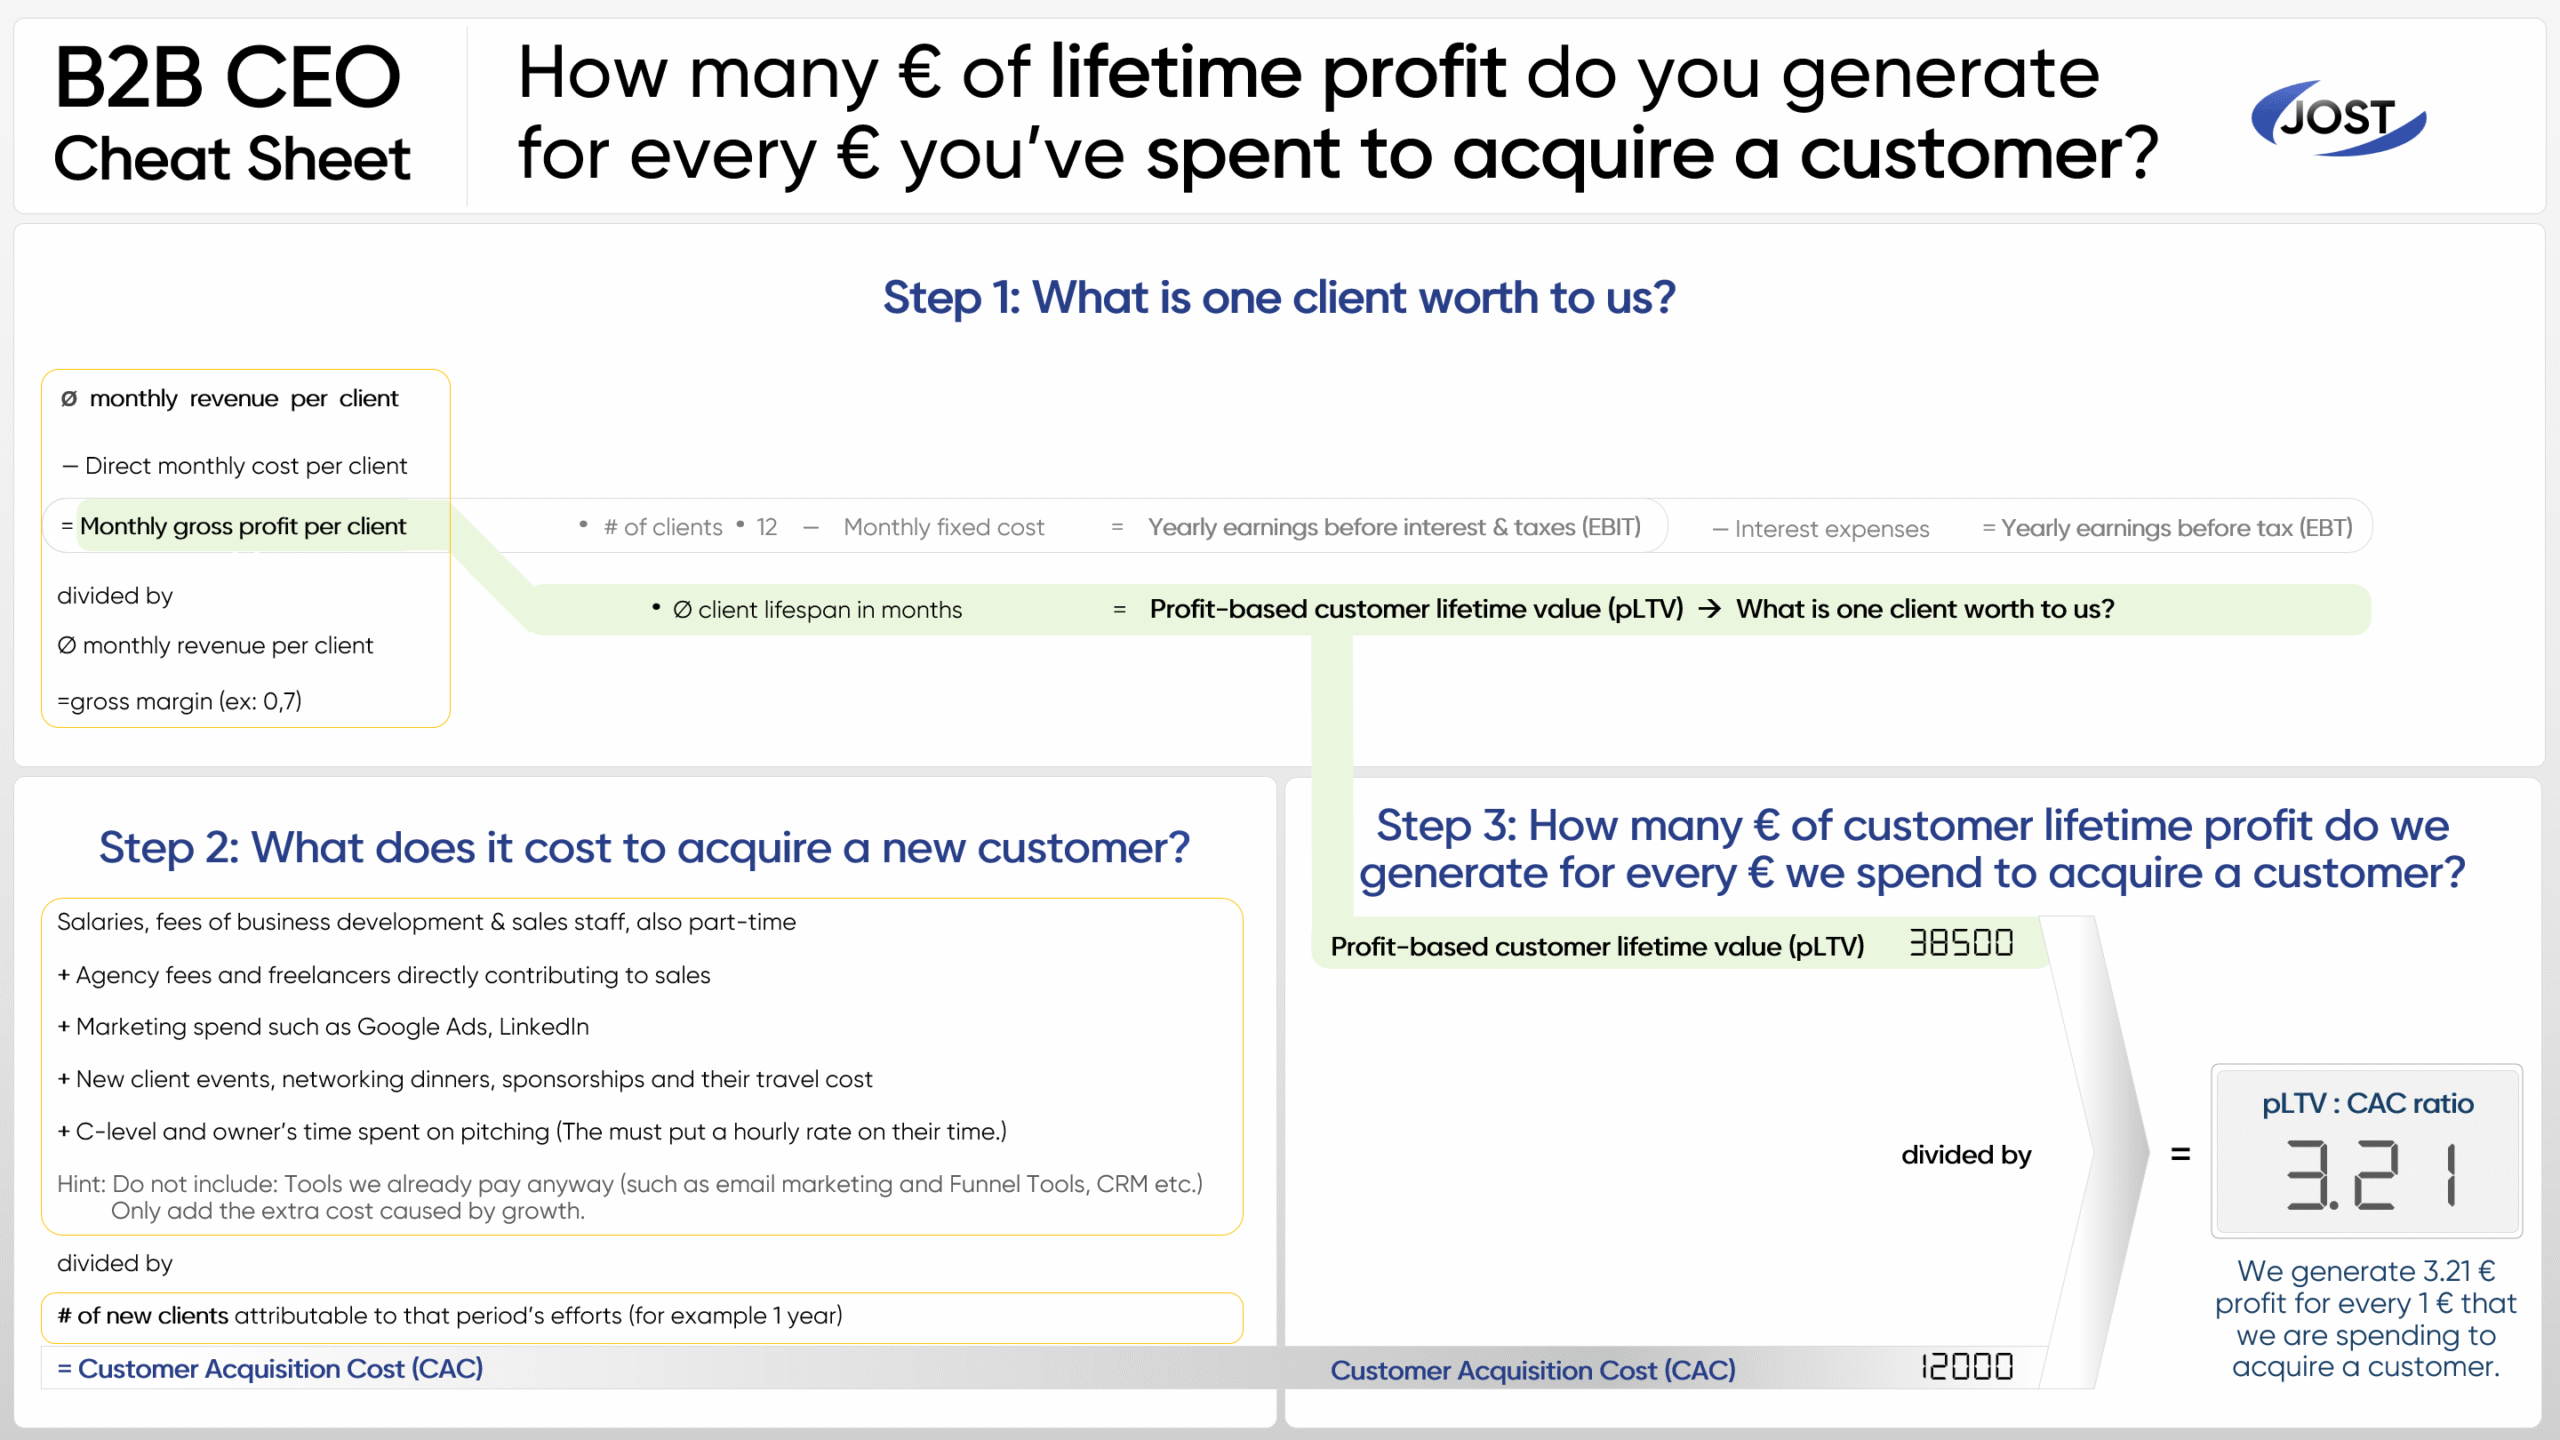
The following graphic shows you the 3 steps you need to go through in order to calculate your pLTV:CAC ratio. Step 1 gives you pLTV, Step 2 calculates CAC (Customer Aquisition Cost) and in Step 3 you have nothing more to do than divide pLTV by CAC.
Infographic: How revenue, lifetime profit and cost to acquire a customer is connected
I know many CEOs typically look at earnings before tax (EBT). However, this can be misleading. EBT shows you a current snapshot only. In my experience, it is equally important to consider your pLTV : CAC ratio on a regular basis.
Why?
Your pLTV : CAC ratio shows you where your business is headed! It separates the investment aspect from operations cost. It tells you if your business model is sustainable, even before you reach overall profitability (or when you change your business model).
Example for your LTV:CAC ratio
If you are reaching 20,000 dollars profit for a typical client (over the entire time of the client relationship), divided by 5,000 dollars cost to acquire one, that would equal four. Which means that you are earning each dollar four times back that you had originally spent on acquiring your client. A very nice ratio!
One aspect that many business have a challenge with is calculating their cost to acquire a new client.
My recommendation, take the last six months and add it all up:
- What did you spend for salaries, for sales staff, also part-time?
- Fees for external business development?
- External agency fees or freelancers who directly contribute to sales?
- Marketing spending for paid ads such as Google and LinkedIn?
- Cost for client events, networking dinners, or sponsorships?
- Hours that C-level and owners spent on selling or pitching?
This sum stands for the last six months. The question is: How many clients did you get in this time? Take this number (let’s say you got 3 new clients) and divide that cost amount by those 3 new clients.
This is now your CAC — your cost to acquire a new customer.
Your business depends on this ratio
Your profit based Lifetime Value per client divided by your Cost to acquire one new client!
This shows you the dollar amount that you can make, over the time that you are working with one typical client, for each single dollar that you had to spend to get this very client.
3 Things that LTC:CAC ratio cannot do for you
1) pLTV-to-CaC ratio is not a measure of your current cash flow or near-term profitability
Business owners often see a strong ratio (e.g., 5:1) and think they’re highly profitable right now. But pLTV is a lifetime projection and does not reflect your bank balance. You could have a fantastic ratio while bleeding cash for 12 or more months waiting to get your acquisition cost back. Or simpler: The ratio tells you nothing about payback period or your short-term liquidity. Your liquidity is the one most critical factor for actual survival, and you must monitor it separately each week.2) You cannot automatically assume your business is scalable at 10x
A high ratio doesn’t mean you can acquire unlimited customers at that same cost. Many B2B owners mistakenly think “our ratio is 6:1, so we should pour money into sales.” No. This ratio is not taking market saturation into account. So check market size, saturation, and test how much your CAC rises if you start to put more money into sales.3) A high pLTV-to-CaC ratio is often mistakenly believed to mean the entire company is extremely healthy
The ratio does not account for massive fixed costs (like R&D, G&A, product development, or general overhead). You could have a 5:1 LTV:CAC, but if your R&D costs are through the roof, the company could still be losing money overall. I have said this in the past and here it is again: Your fixed cost should always be as low as humanly possible. I’m afraid, prestige hungry owners with huge offices and huge rents are not typically the ones who will make it in the long run. Hunger for status gets you killed.
When is a single pLTV:CAC ratio not enough?
When your customer base is diverse, one healthy-looking pLTV:CAC ratio can fool you. It can even be dangerous. Why?
A single average pLTV:CAC can hide the truth. A few “great clients” with a high pLTV/CAC can cover up many mediocre clients with a low or even negative pLTV:CAC. These clients quietly drain your cash.
The solution is simple. Stop using one blended average. Start calculating pLTV:CAC by groups. Many people call this segmentation.
Here is how you do it
Your goal is to divide customers into groups based on traits that influence their value and their acquisition cost. What you need to do is calculate one pLTV for each group and one CAC for each group. This will give you one specific pLTV-to-CAC ratio for each group.
Option 1: Group clients by acquisition channel
The cost to acquire a client changes a lot depending on where they came from. So we create:
- Group 1: Organic or Referral — People who found you through word of mouth, SEO, or direct recommendations.
- Group 2: Paid Ads — People who clicked through a Facebook or Google campaign.
- Group 3: Sales Team or Events — People acquired through a high-touch process like trade shows, cold calls, or product demos.
What this reveals:
You may see that your Paid Ads group has a strong LTV:CAC of 4. But your Sales Team group has a weak LTV:CAC of 1.5 because commissions and travel costs are too high.
What you can do:
- Reduce spending in the Sales Team channel and invest more in Paid Ads.
- Or change the offer or bundle your sales team uses so you attract a different kind of customer through that channel.
The Alternative: Group clients by profile or size
This is the fastest way to see your “great clients” and your less profitable ones.
How to group them: Focus on traits that have a big impact on profit.
- Group A: Small Businesses — One to five employees or spending below a threshold like under 900 dollars per month.
- Group B: Mid-Market — Five to fifty employees or spending in your mid-tier range.
- Group C: Enterprise — Large clients who spend the most and usually drive most of your profit.
You may discover that the enterprise Group C has an LTV:CAC of 10. These are your truly profitable clients.
But Group A has an LTV:CAC of 0.8:1. That means you lose money on every small client you acquire. The “great clients” are covering the losses.
It’s not uncommon to see that two very large clients generate almost all of your profit. And nine others barely move the needle. This also means you might be dependent on those two clients. They can make or break your future.
Bonus tip: Group clients by the time period you acquired them
This is called cohort analysis. A cohort is simply customers who joined in the same quarter.
This helps you see if your LTV and CAC assumptions still hold over time.
You might have calculated an overall LTV:CAC of 3:1 last year. But when you check the same quarter this year, you might see the ratio dropping.
This can happen because customers churn faster. Or because your business is large and you or the competitors are starting to saturate your market.
In any case, this is an early warning sign. Something changed for your newer customers. Maybe your sales pitch changed. Maybe a competitor launched.
When you calculate pLTV:CAC for different groups, you stop relying on a misleading average. Instead, you are creating a profit map of your business. This is how you avoid depending on a handful of clients and how you catch early signals if your market starts shifting.
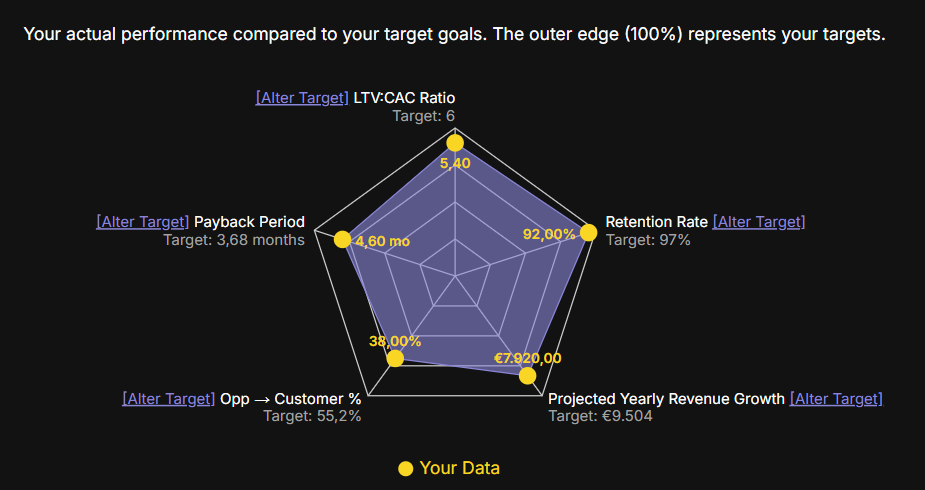
Visualize LTV:CAC ratio and other essential B2B metrics
It is for CFOs, owners and strategic marketers who don’t like to be tracked.
✓ No registration required
✓ Own and export your data to a file.
✓ Run and use on any device